Cloud connected acoustic vibration sensing
Combining the Zephyr RTOS, digital signal processing and bare metal programming techniques..

Introduction
The Zephyr RTOS offers high level microcontroller peripheral driver abstractions to simplify application development and enable portability across vendors and architectures. However, there are times when one must get “to the metal” to achieve the highest performance metrics such as power consumption. This article will show an acoustic machine monitoring application that uses Zephyr with the Nordic NRF9160 cellular System-In-Package (SIP) combined with high-performance vibration and temperature sensors.
While Zephyr is a very rich embedded development framework, it does not mean that you have to give up any of the advantages of “bare metal” for high performance applications. In fact, you can get the best of all worlds while having a development framework that scales across projects. Specifically, we will cover how to:
- Access peripherals directly for minimal overhead
- Have direct access to IRQ handlers to weave peripherals together in ways not supported by the Zephyr driver model.
- Use the Zephyr build system to bring in DSP libraries to implement acoustics & vibration processing algorithms such as a power spectrum computation.
- Apply direct peripheral access techniques to achieve the lowest sleep currents for industrial IoT / battery powered applications.
Battery Powered Acoustic Machine Condition Monitoring
Cellular System in Package (SIP) Technologies, such as the Nordic nRF9160, offer a high level of integration enabling densely packaged sensor solutions. In addition to enabling point connectivity, the nRF offers sufficient processing power to handle complex sensor fusion and data reduction tasks.
Prior to Nordic nRF9160 and open source RTOS solutions such as Zephyr, cellular based industrial IOT development could be consuming and difficult. A typical method for connecting sensors is to use an intermediate wireless network. It is common to network sensors via a local wireless connection. Raw sensor data is collected into a “bridge”. The bridge which may have more significant processing capabilities and high-level operating system such as Linux to deal with intricacies of modern, secure connectivity. With Zephyr and the nRF9160, it is possible to do all precision measurements and data processing in-situ and securely connect to a backend without an intermediate bridge. This point of measurement connectivity approach can greatly simplify deployment of sensors for predictive maintenance and conditioned based maintenance applications.
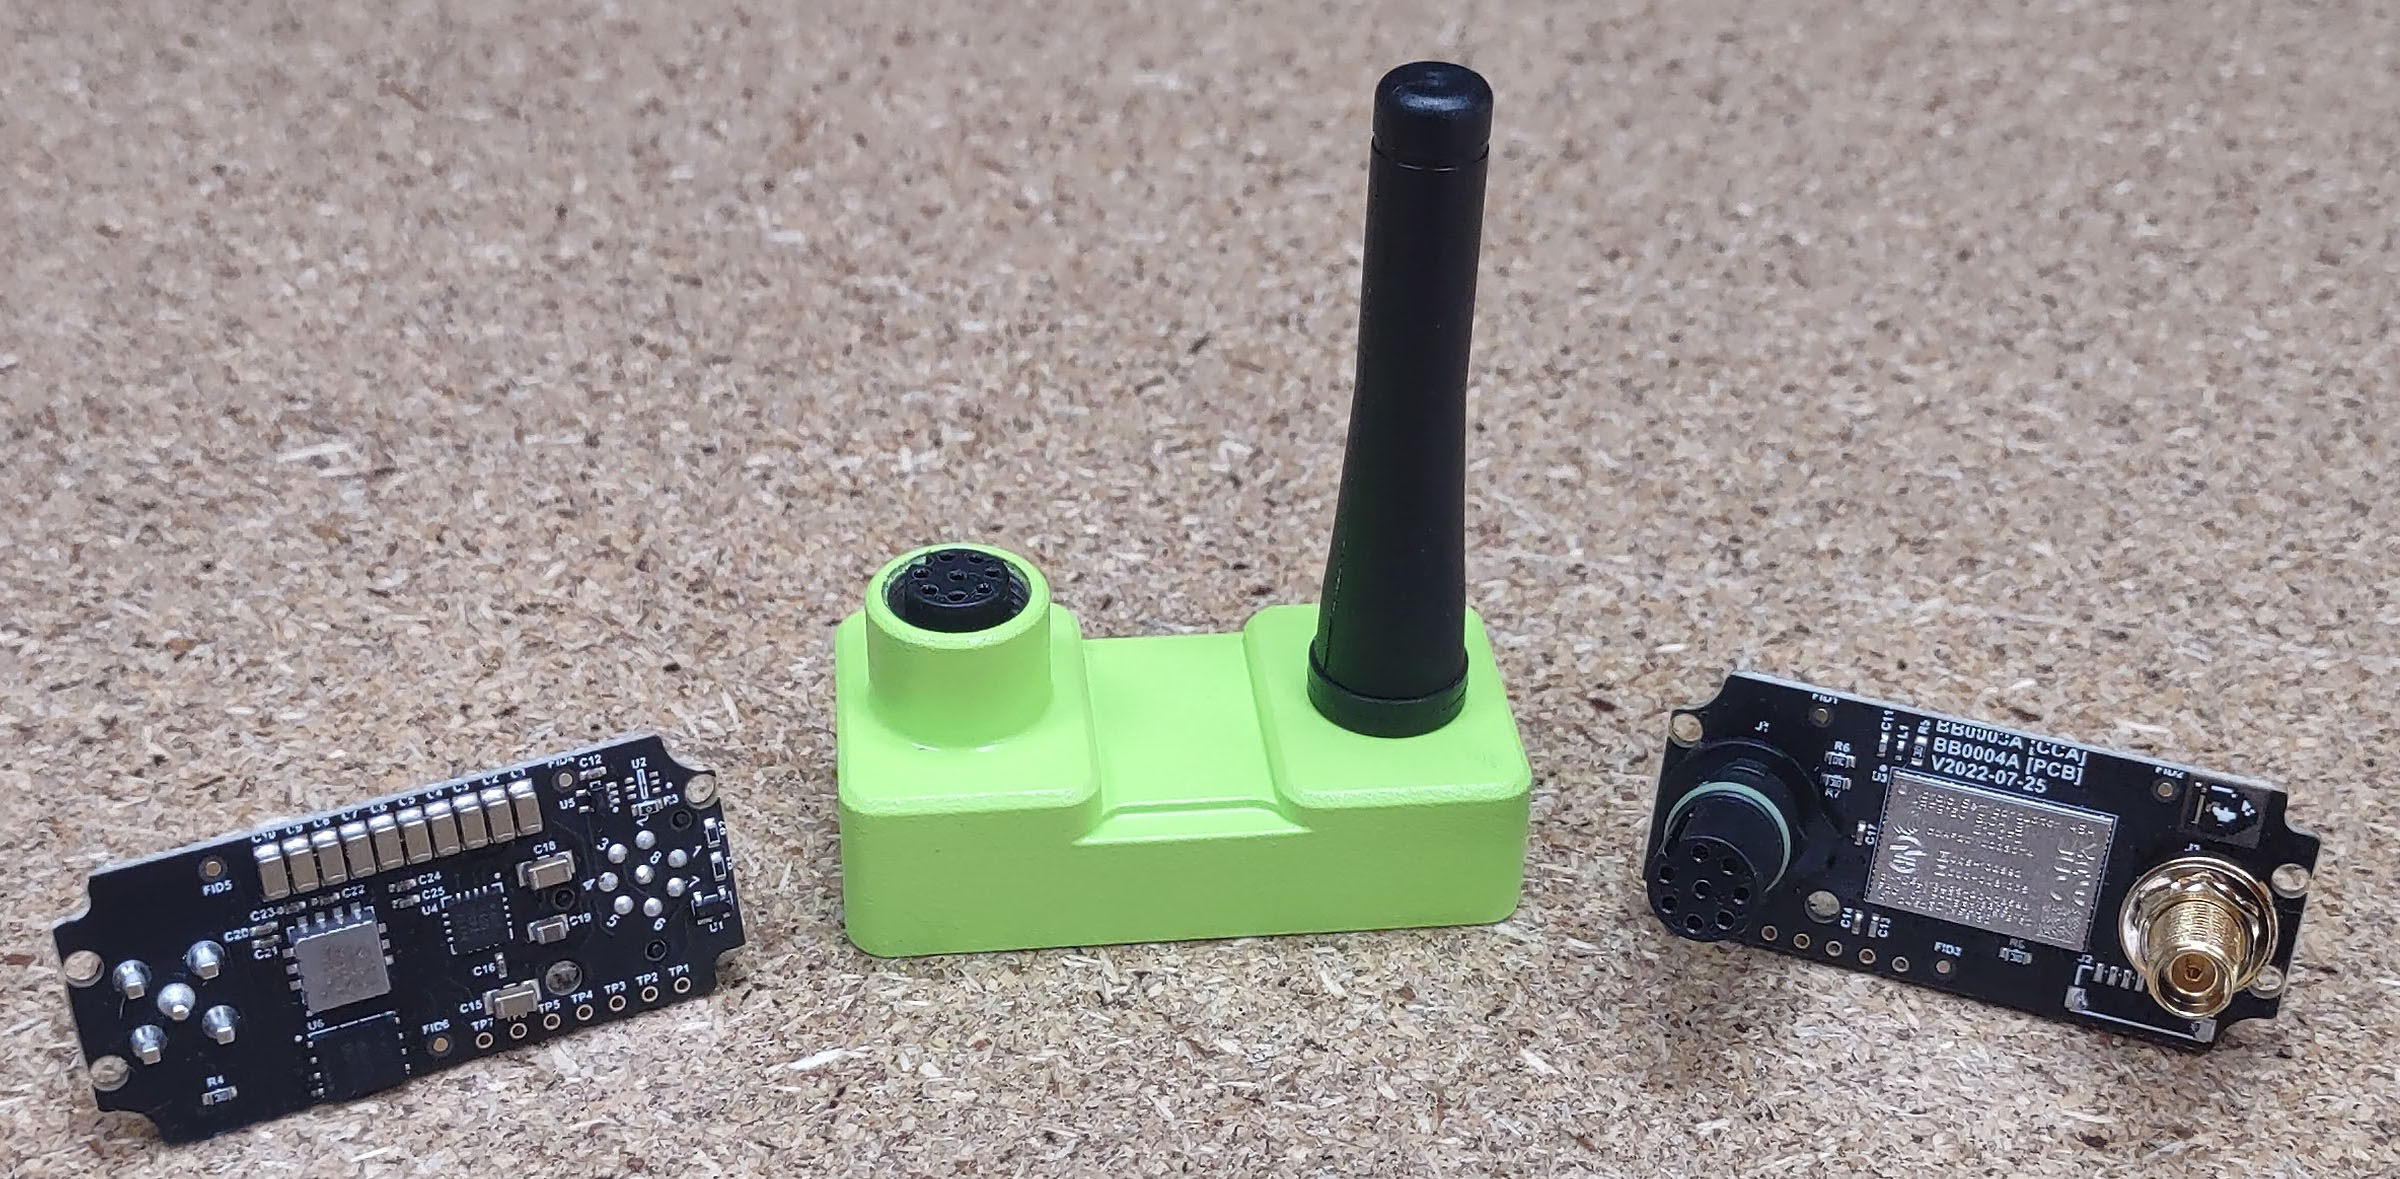
The nRF9160 can be battery powered using ruggedized chemistries such as lithium thionyl chloride (Li-SoCl2) for years of operation in the most demanding environments. An example of a point of measurement industrial IOT sensor is the MachineMailbox.
One of the best methods of implementing machine health on critical, high value equipment is to analyze the vibration of the machine in real-time. Using high bandwidth accelerometers, it is possible to ascertain the health and possible future failures of a critical asset over time. Combining frequency domain analysis with typical sensing modalities, such as temperature, one can perform complicated sensor fusion and data reduction at the point of measurement. Data fusion and reduction at the “extreme edge” reduces the amount of data needed to be transmitted to a backend improving both transmission costs and battery life. Cloud based machine learning and trending algorithms can have access to just the right amount of data to balance complexity in the sensing node and the backend processing.
The MachineMailbox Vibration Sensor Interface
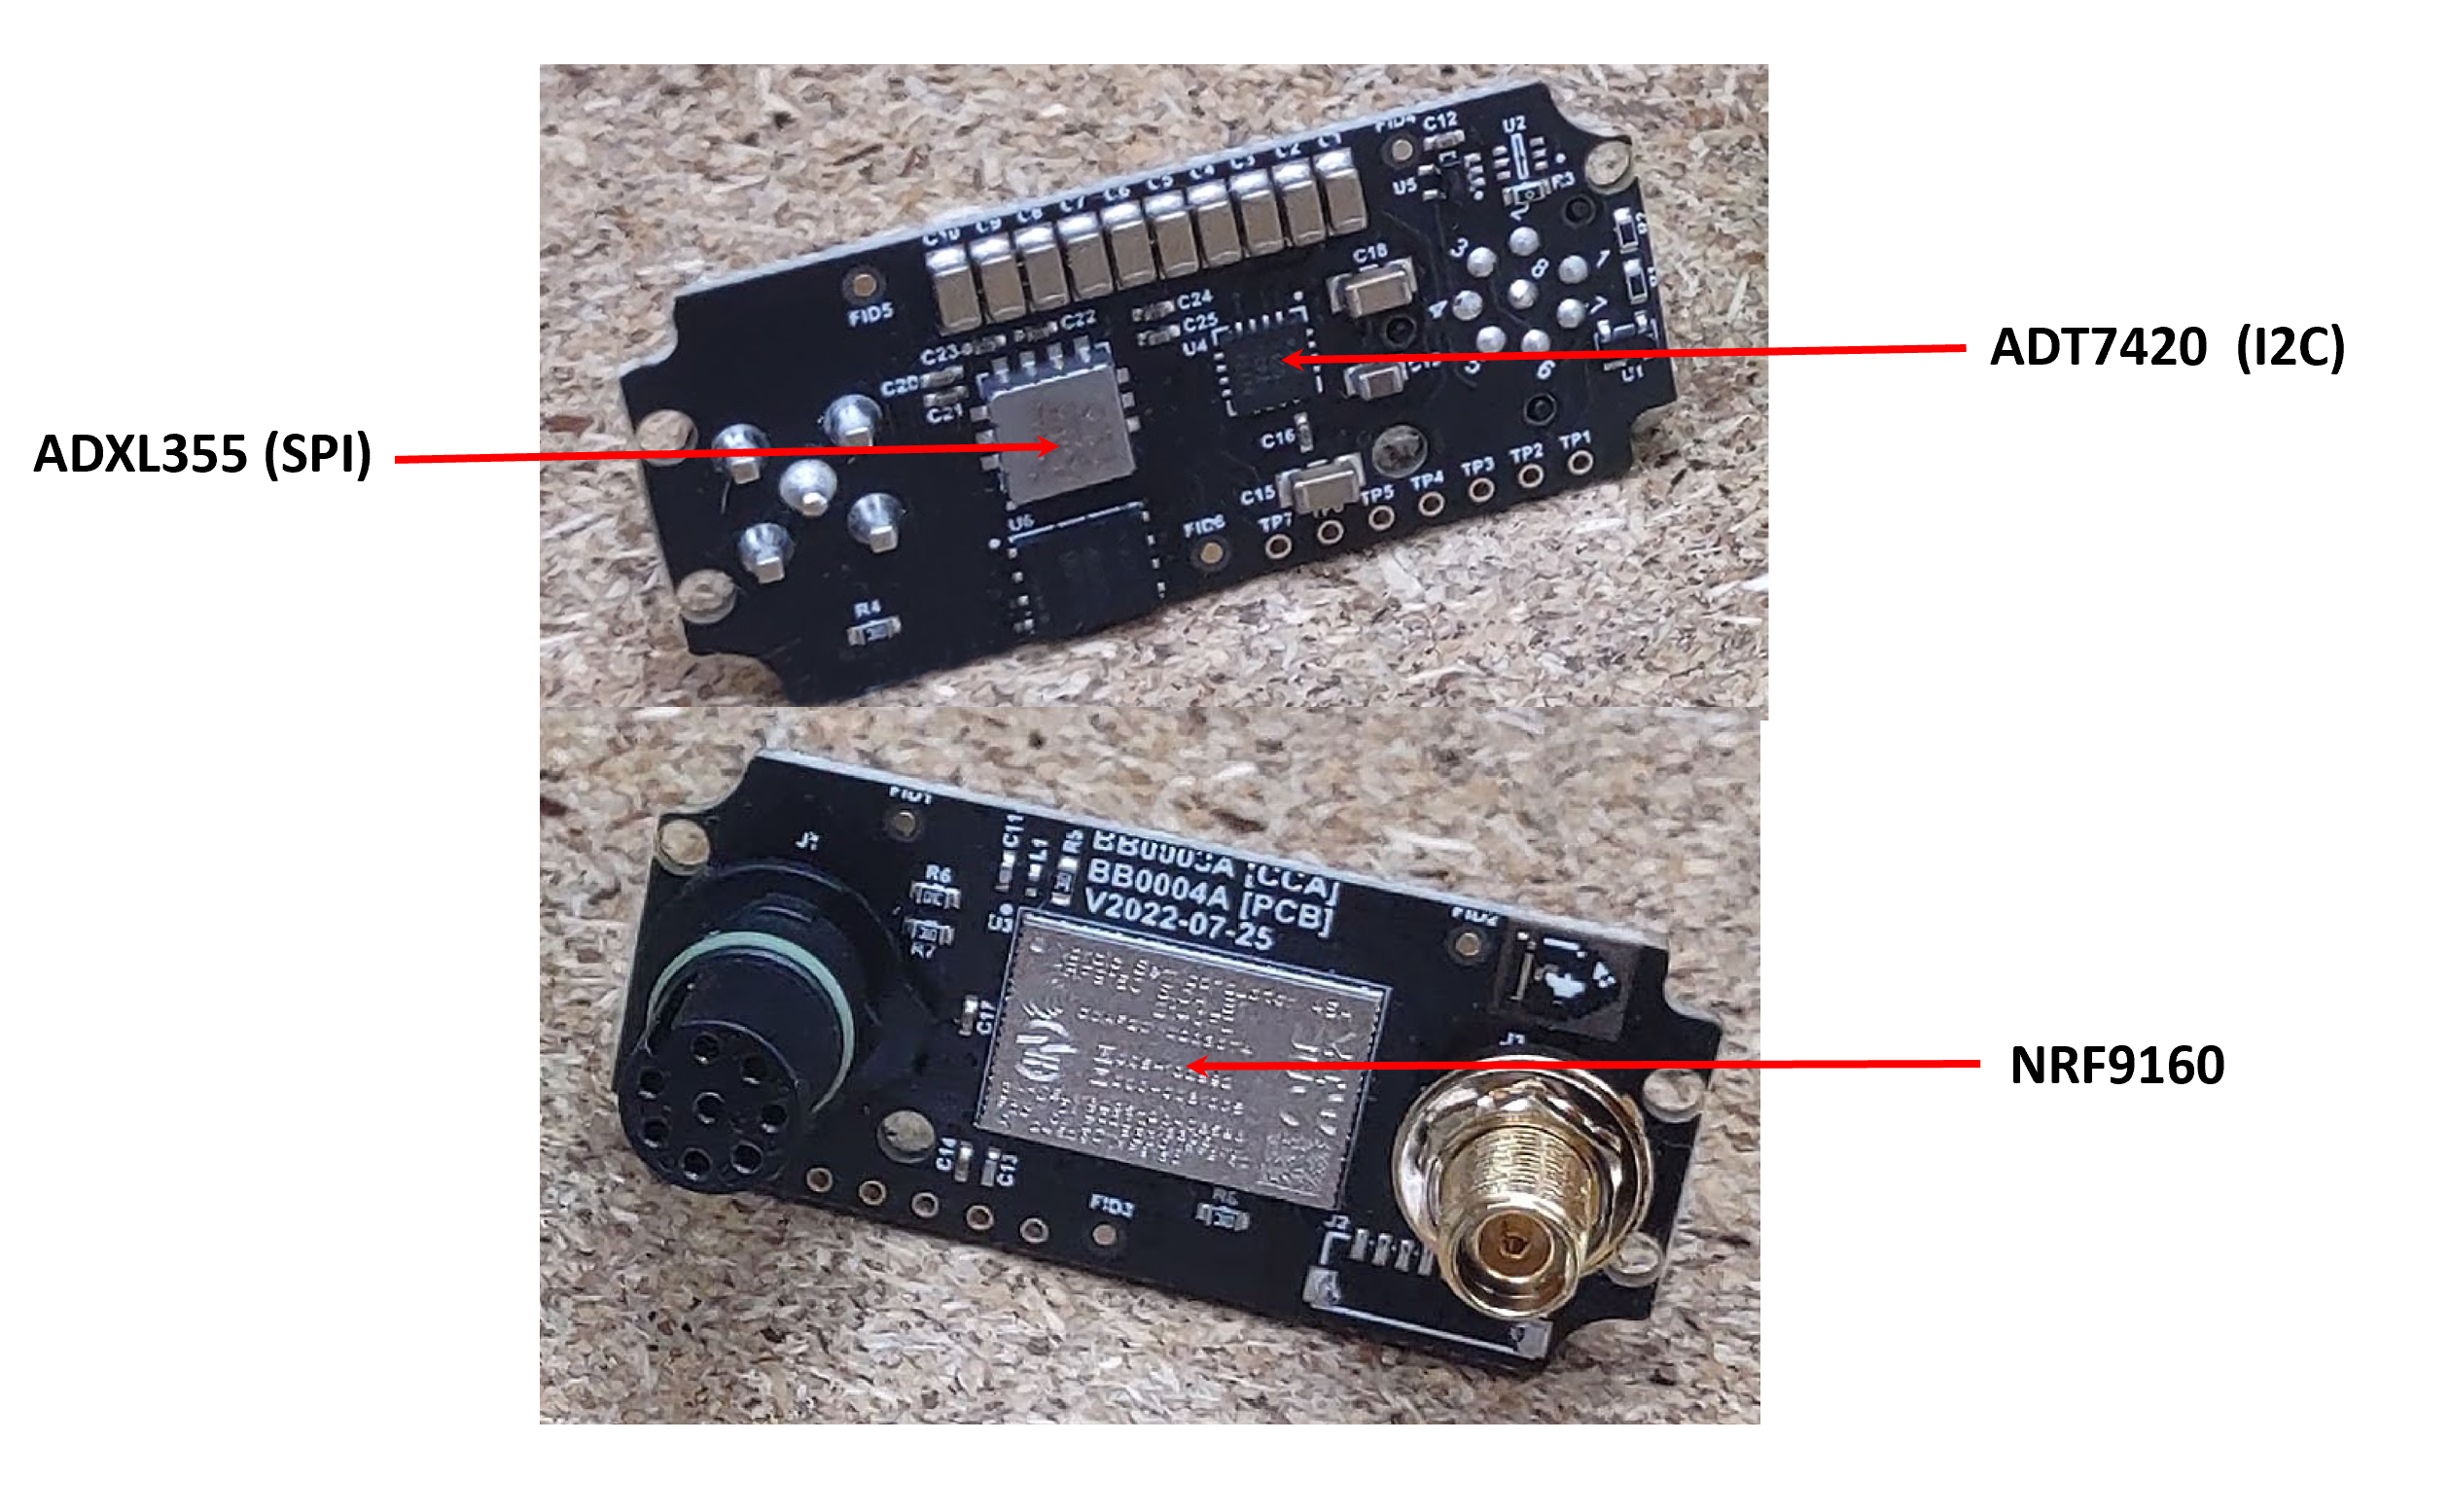
The MachineMailBox combines the nRF9160, an Analog Devices ADXL355 3-Axis MEMs accelerometer and an ADT7420 temperature sensor.
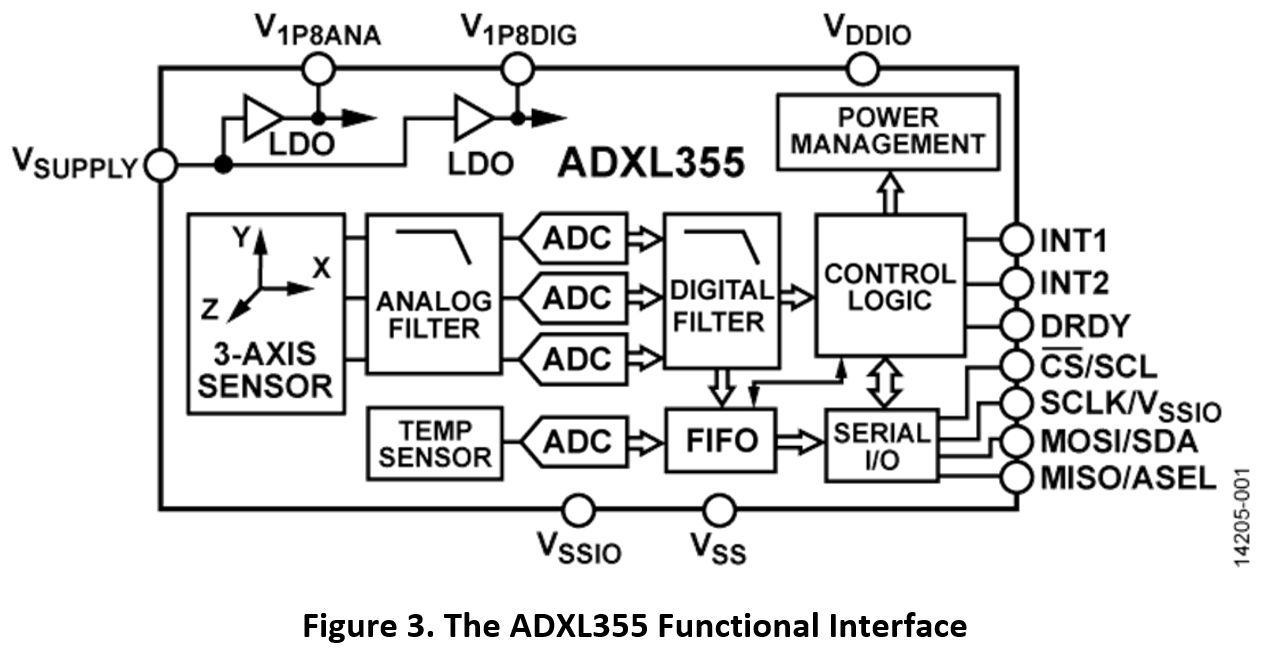
Two important considerations when selecting an accelerometer for machine condition monitoring are bandwidth and noise spectral density. The majority of MEMS accelerometers used for orientation and motion control are optimized for low frequency / DC operation but exhibit significant spectral noise in the regions of interest for structural vibration analysis. The ADXL355 operates in the sweet spot of structural acoustics with a 2KHz usable bandwidth and 22ug/ √Hz noise spectral density.
https://www.analog.com/en/technical-articles/mems-accelerometers-for-condition-monitoring.html
Noise spectral density is an important and often overlooked metric when selecting an acoustic sensor. Often the magnitude of vibration of interest is extremely small. Acoustic analysis for machine health and trending is performed in the frequency domain. A power spectral density computation is often the best choice for understanding energy in a vibrating system. The low noise spectral density properties of the ADXL355 combined with processing gain of a Fourier transform based algorithm means one can resolve the smallest of characteristics in a vibration system.
For the MachineMailbox design, the ADXL355 was connected to the nRF9160 via its SPI interface. The ADXL355 implements a sigma-delta ADC inside of the device package. Streaming vibration data is converted and placed in a FIFO which can be read via SPI transactions.
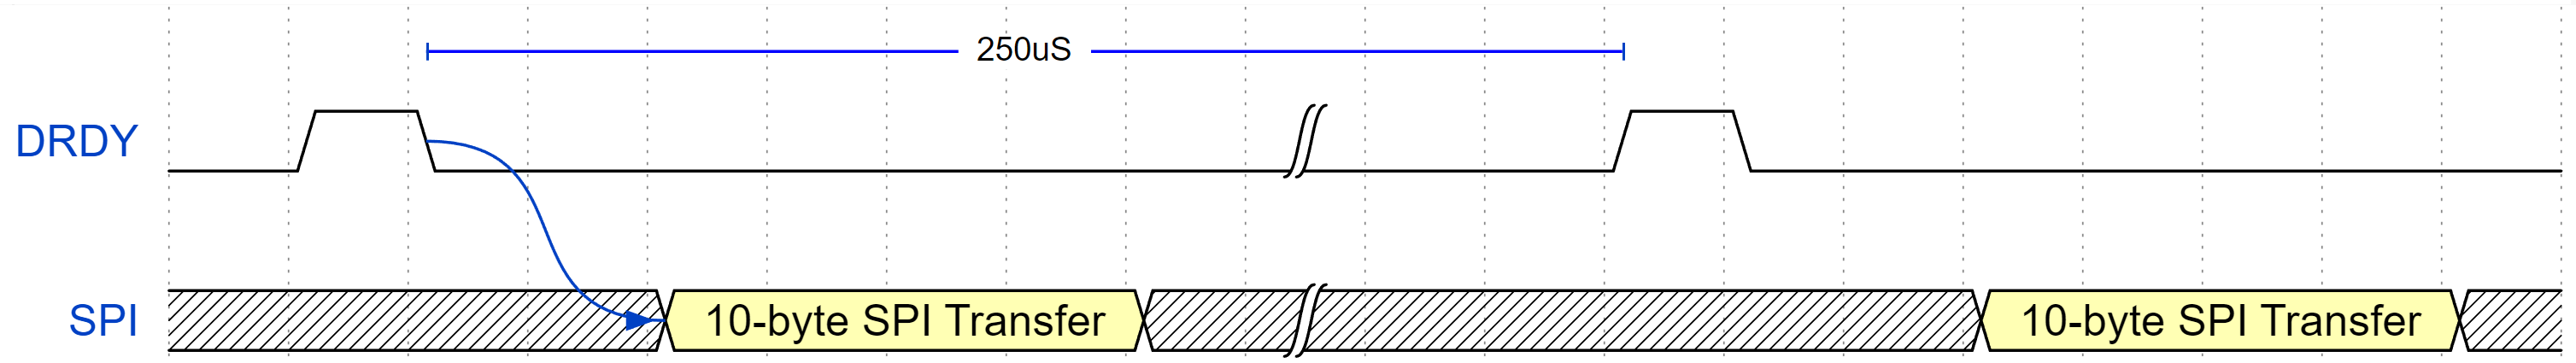
An important point to consider is that once the data stream is started, measurements are pumped into the FIFO continuously. The FIFO is 96 words deep, so it is important to read out data fast enough so there are no discontinuities in the data. The MachineMailbox used the ADXL355 with a 4KHz output data rate (ODR). New sample data is ready every 250uS.
It would be possible to continuously poll the FIFO over the SPI bus. However, this approach is inefficient in terms of CPU activity and energy usage. The DRDY line can be used to efficient trigger read operations. Acquiring a large capture buffer, say 16384 samples, can be done completely in the background with minimum CPU intervention. With 4KHz ODR, SPI transactions need to occur withing the 250uS sample period.
With the nRF9160, we can use a combination of GPIO interrupts and SPI DMA to achieve data capture in a background operation while the CPU spends most of its time sleeping. This approach also frees up time for the code to be accessing the ADT7420 temperature sensor. The ADT7420 is accessed via an I2C connection. It should be read no faster than four times a second. Reads of the ADT7420 can be overlapped with the SPI transactions to ensure the CPU is minimally involved and can be put to sleep when idle. In the MachineMailbox firmware, the ADT7420 is read at a 4Hz sample rate while the ADXL is read at a 4KHz sample rate. Both operations are done with minimal CPU interaction to maximize sleep time.
Direct Peripheral Access Approach
Zephyr has a common driver API for the most common access patterns to typical microcontroller IO (UART, SPI, I2C, etc.). However, when one needs to overlap several IO operations and trigger DMA actions from specific interrupts, it can be simpler to directly program the underlying peripherals using “1st principles” thinking. In a Zephyr system, there is no requirement to use the device driver model. Peripherals can be accessed directly just as in a bare metal system with the understanding that the programmer is responsible for all interactions between bare metal code and the RTOS.
The SPI (called SPIM) and I2C (called TWIM) peripherals in the NRF9160 are simple to use via direct register access. They have been designed to handle the most common access patterns. The SPIM module has “EasyDMA” functionality. EasyDMA enables simple configuration of a single DMA transfer to/from a SPI peripheral. I have found that fewer number lines of code are needed to directly program Nordic peripherals than using a high-level driver API.
For this application, we need to trigger a 10-byte SPI operation whenever the ADXL355 flags new data is ready.
The ADXL355 use case requires smaller transactions to be triggered from an external pin. We can use the NRF GPIOTE module to trigger an interrupt on the rising edge of DRDY. The SPI transmit buffer is fixed in length and content when requesting new sample. It will contain control/address bytes and does not need to change between samples keeps IRQ handling and restarting DMA operations simple.
Note: The NRF9160 does have a specialized Distributed Programmable peripheral Interface (DPPI) mechanism that can link events between peripherals to reduce interrupt handling. However, I specifically did not use it as I needed to perform some ancillary operations when new sample data is ready and wanted to show a direct IRQ example in Zephyr.
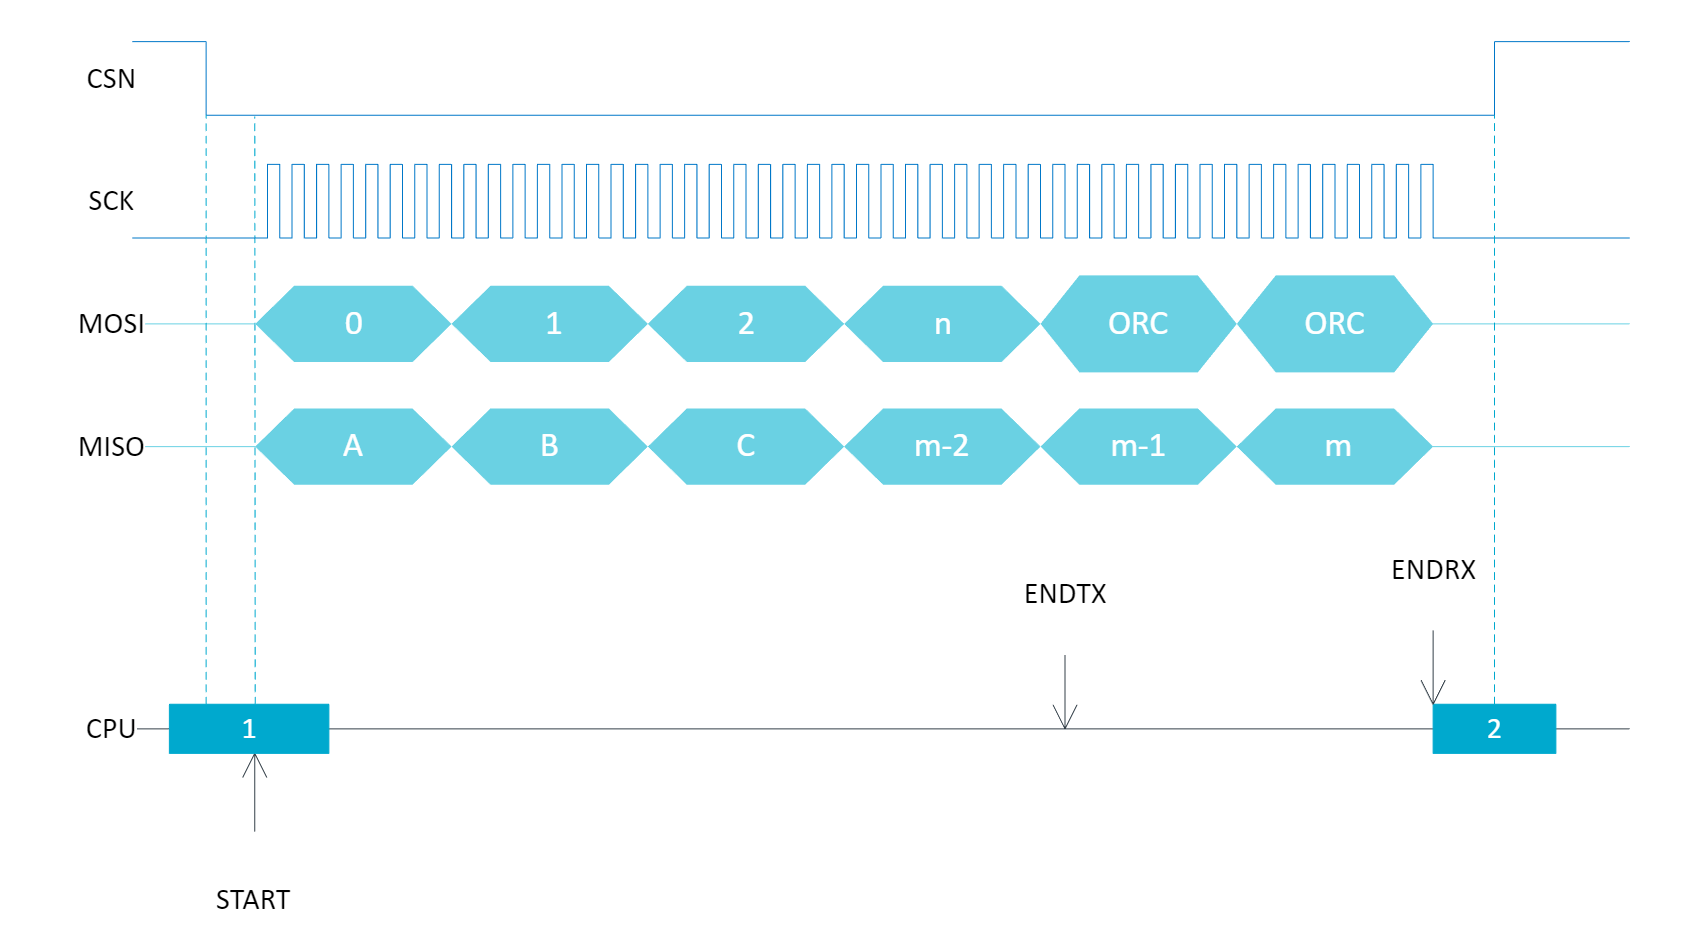
In the MachineMailbox application, the capture buffer for vibration data is 16384 samples in length. The process for capturing a vibration generally followed these steps:
- Receive GPIOTE IRQ triggered by the rising edge of ADXL355 DRDY.
- Format / store data from the last SPI DMA transfer, except on the 1st interrupt.
- Assert the ADXL355 Chip Select
- Start the next SPIM EasyDMA transfer if the capture buffer is not full.
- Use SPIM ENDRX IRQ to de-assert CS and flag that capture is complete if the capture buffer is full.
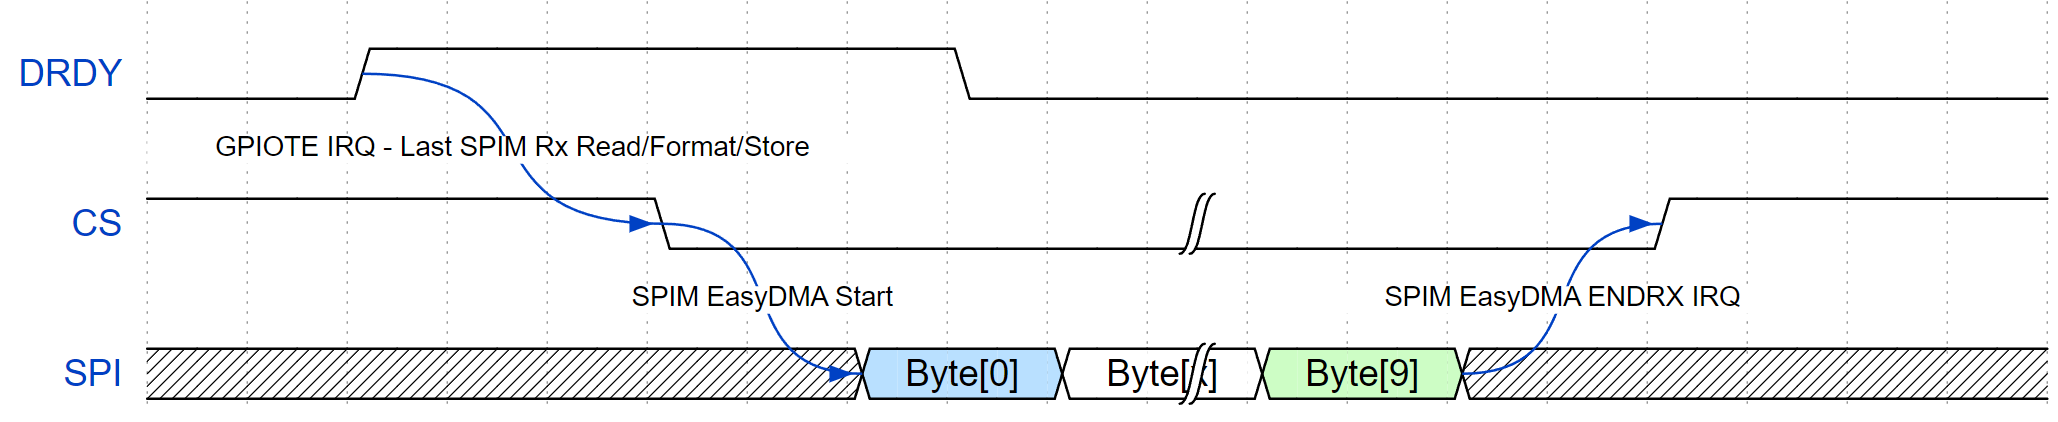
Graphically we can show this interaction as:
Zero Latency IRQ Handling
In the Zephyr application prj.conf, zero latency IRQS are enabled with a single kconfig setting.
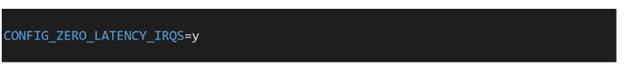
In the MachineMailbox application, I used direct IRQ handling for the SPIM2 and GPIOTE peripherals.
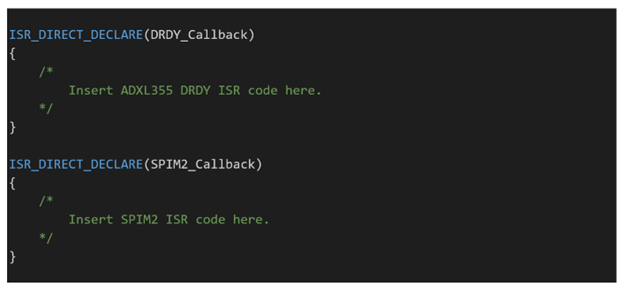
The ISR_DIRECT_DELCARE macro will add platform specific tasks before and after your routine so it can “plug in.” The nRF9160 uses a Cortex M, so you can see what this macro does in the file
arch/include/arm/aarch32/irq.h
I always inspect these low-level macros to know exactly what is going on.
You can poke around in the platform irq.h to inspect the macros wrapped around your IRQ handler. In the case of the Cortex-M, the wrapper is thin and resolves to very little additional code. It is possible to 100% examine what is added to understand the implications for real-time performance.
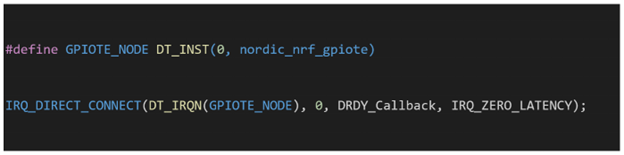
The IRQ_DIRECT_CONNECT is used to attach your specific callback function to an IRQ index. This macro will implement any platform specific behaviors to get your function pointer in the IRQ vector table.
The 1st argument is the platform specific IRQ number. I pulled this from NRF9160.h in modules\hal\nordic\nrfx\mdk
It is also possible to pull IRQ index from the device tree. As an example, I connected the GPIOTE IRQ handler using the IRQ index from the device tree.
You can find more information about direct connected IRQs in the Zephyr documentation:
https://docs.zephyrproject.org/apidoc/latest/group__isr__apis.html
If you want more examples of how to use direct IRQs, you can read through the source code of various peripheral drivers for a specific microcontroller.
Once I put all the IRQ & DMA logic together, I capture the real-world timing with a logic analyzer.
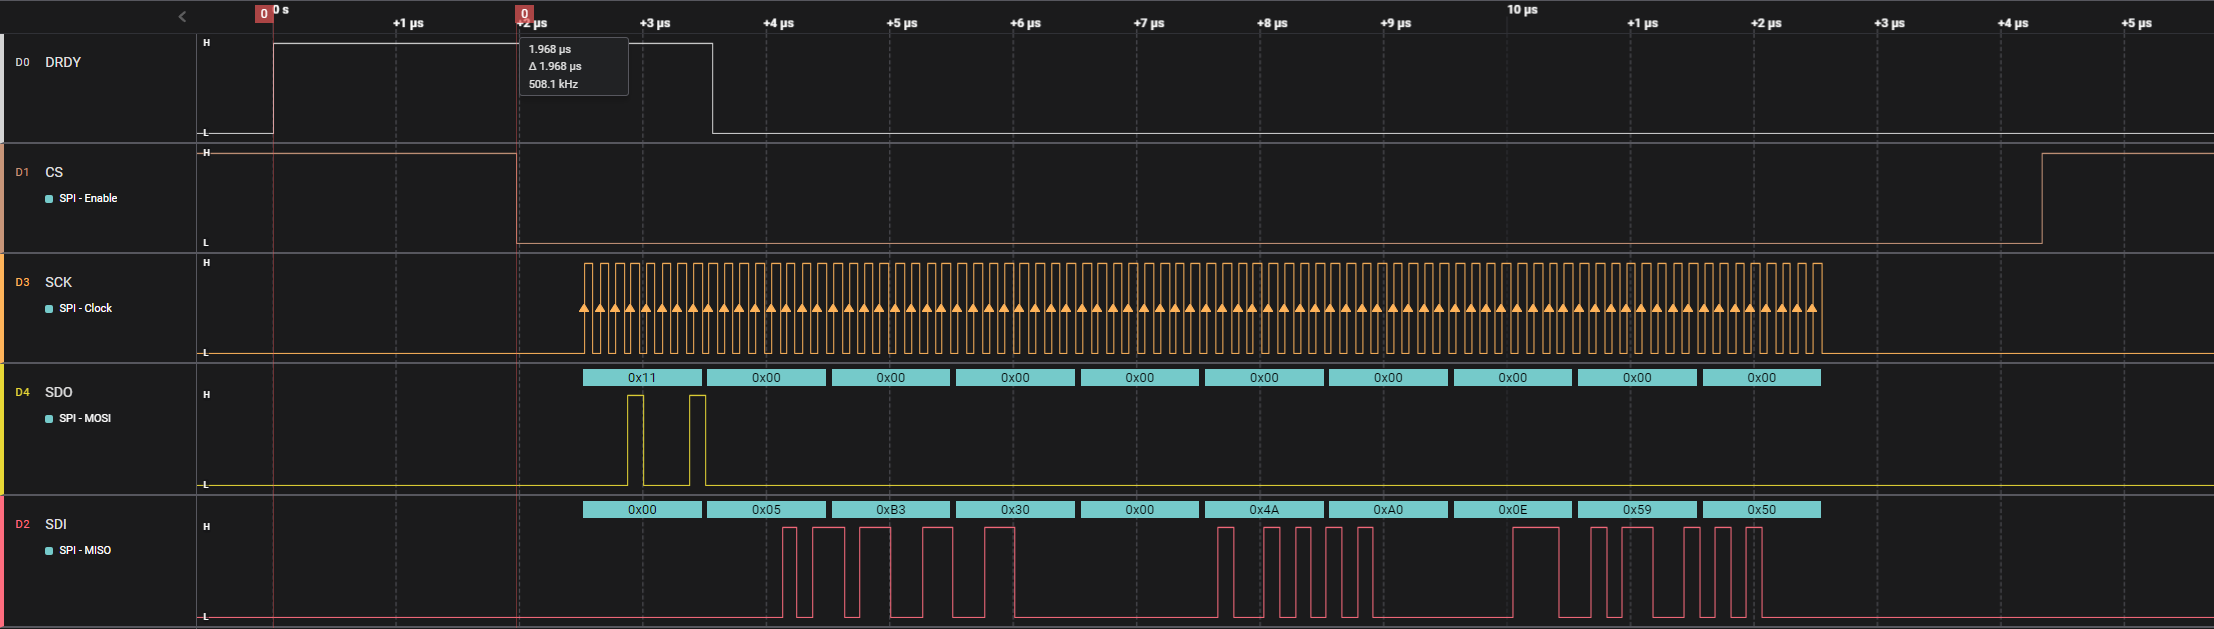
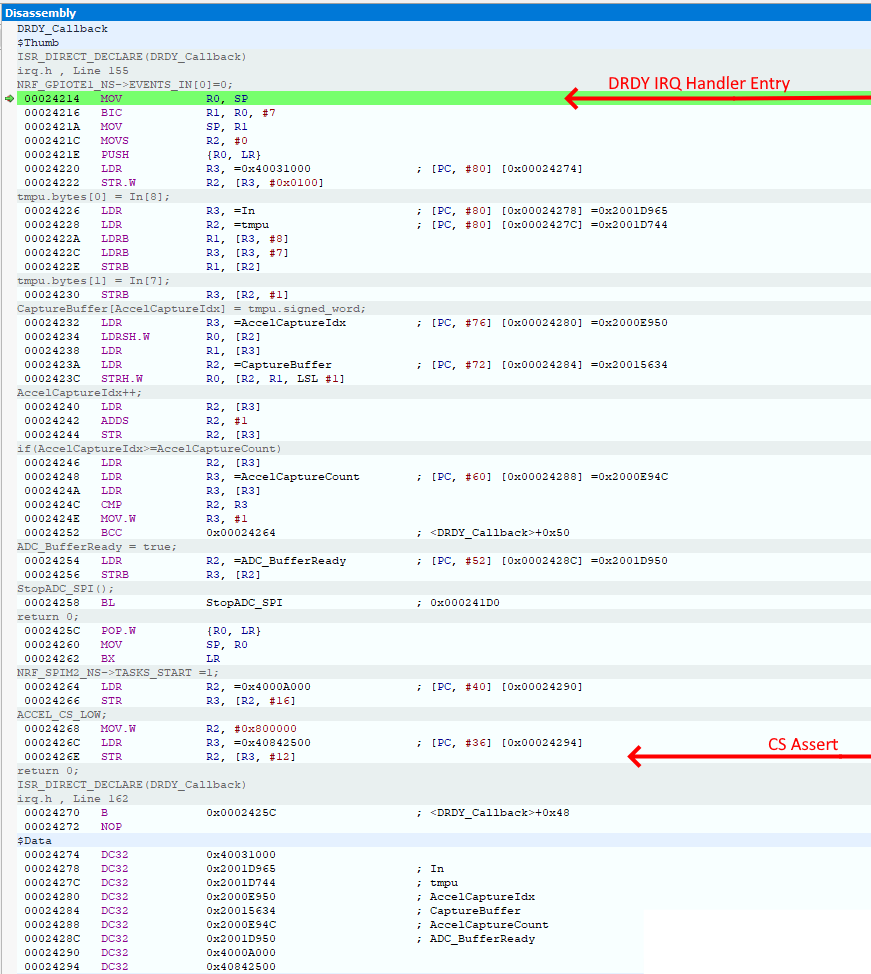
With the 1st implementation, I measured an approximate 2uS latency between assertion of DRDY and the assertion of CS. The IRQ handler had to perform some housekeeping and buffer management. When I consider the 64-MHz nRF9160 clock rate, flash execution access time, and the assembly code generated by the compilers (from the direct IRQ wrapper and my C code), this latency could all be accounted for. With time critical IRQ code, it is a good idea to inspect any code the compiler generates. I like to peek at what the compiler generates to see that everything is in order.
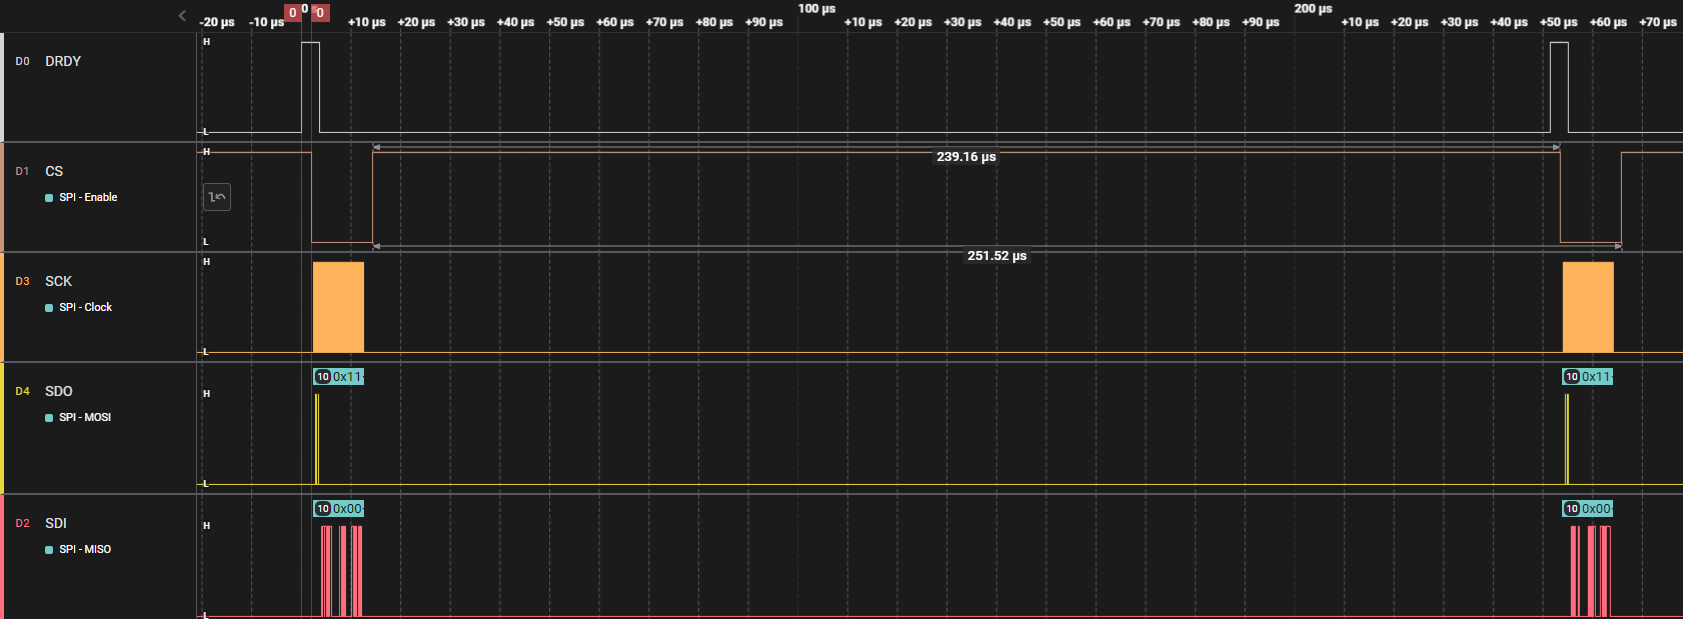
The 1st implementation was well within the “good enough” margin to meet my real-time deadlines. Zooming out, I could see that this implementation left quite a bit of idle time for the CPU to enter a sleep.
While this SPIM/GPIOTE code was running in the background to capture a 4 second vibration data buffer, I could also do bare metal access to the I2C peripheral (called TWIM in the NRF9160) to record the temperature sensor. Accessing registers directly is as simple as including the NRF9160 headers:
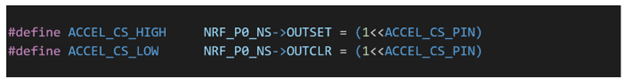
You can then access device registers the same as any other bare metal application. For example, setting or clearing an IO pin is as simple as:
This approach makes IO access both fast and simple. The trade-off of this approach vs the Zephyr device driver model is application portability. However, given the specialized nature of this application and the specialized nature of the nRF9160, this was an easy trade to make.
The MachineMailbox DSP and Data Processing Approach
Many acoustic machine monitoring applications boil down to analyzing data recorded from rotating machinery and connecting physical structures. The measured time signal consists of cyclical behaviors combined with a relatively stationary background noise. In many applications, the cyclical behavior you are looking for can be small in magnitude in relation to other stochastic elements in the signal. The background “noise” is typically stationary which is a fancy way to say the statistics of the noise don’t change significantly over the timescale you are looking at.
Frequency domain processing is a highly efficient method for separating the different components in complex acoustic data. The workhouse of frequency domain analysis in acoustic machine monitoring is a power spectrum estimation.
https://en.wikipedia.org/wiki/Spectral_density
The simplest explanation of the power spectrum output is a set of magnitude squared values (V2, g2) the signal normalized to some spectral width (commonly 1Hz). A power spectrum can give one an estimate of where the energy of signal is at in the frequency domain. This is helpful when analyzing signals which are known to have cyclical characteristics. The power spectrum is mathematically defined for infinitely long, continuous signals. However, we exist in the real world of finite sample data. A common approach to estimating a power spectrum of discrete data is via Welch’s method.
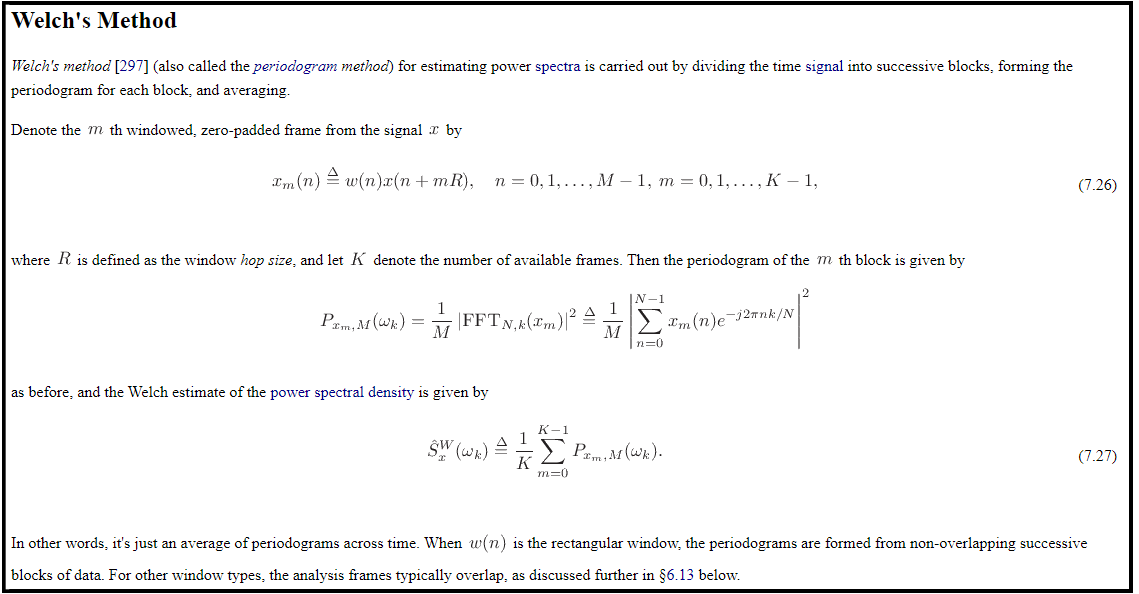
DSP code can look obtuse from the purely mathematical expression. However, it is relatively simple to show the algorithm graphically.
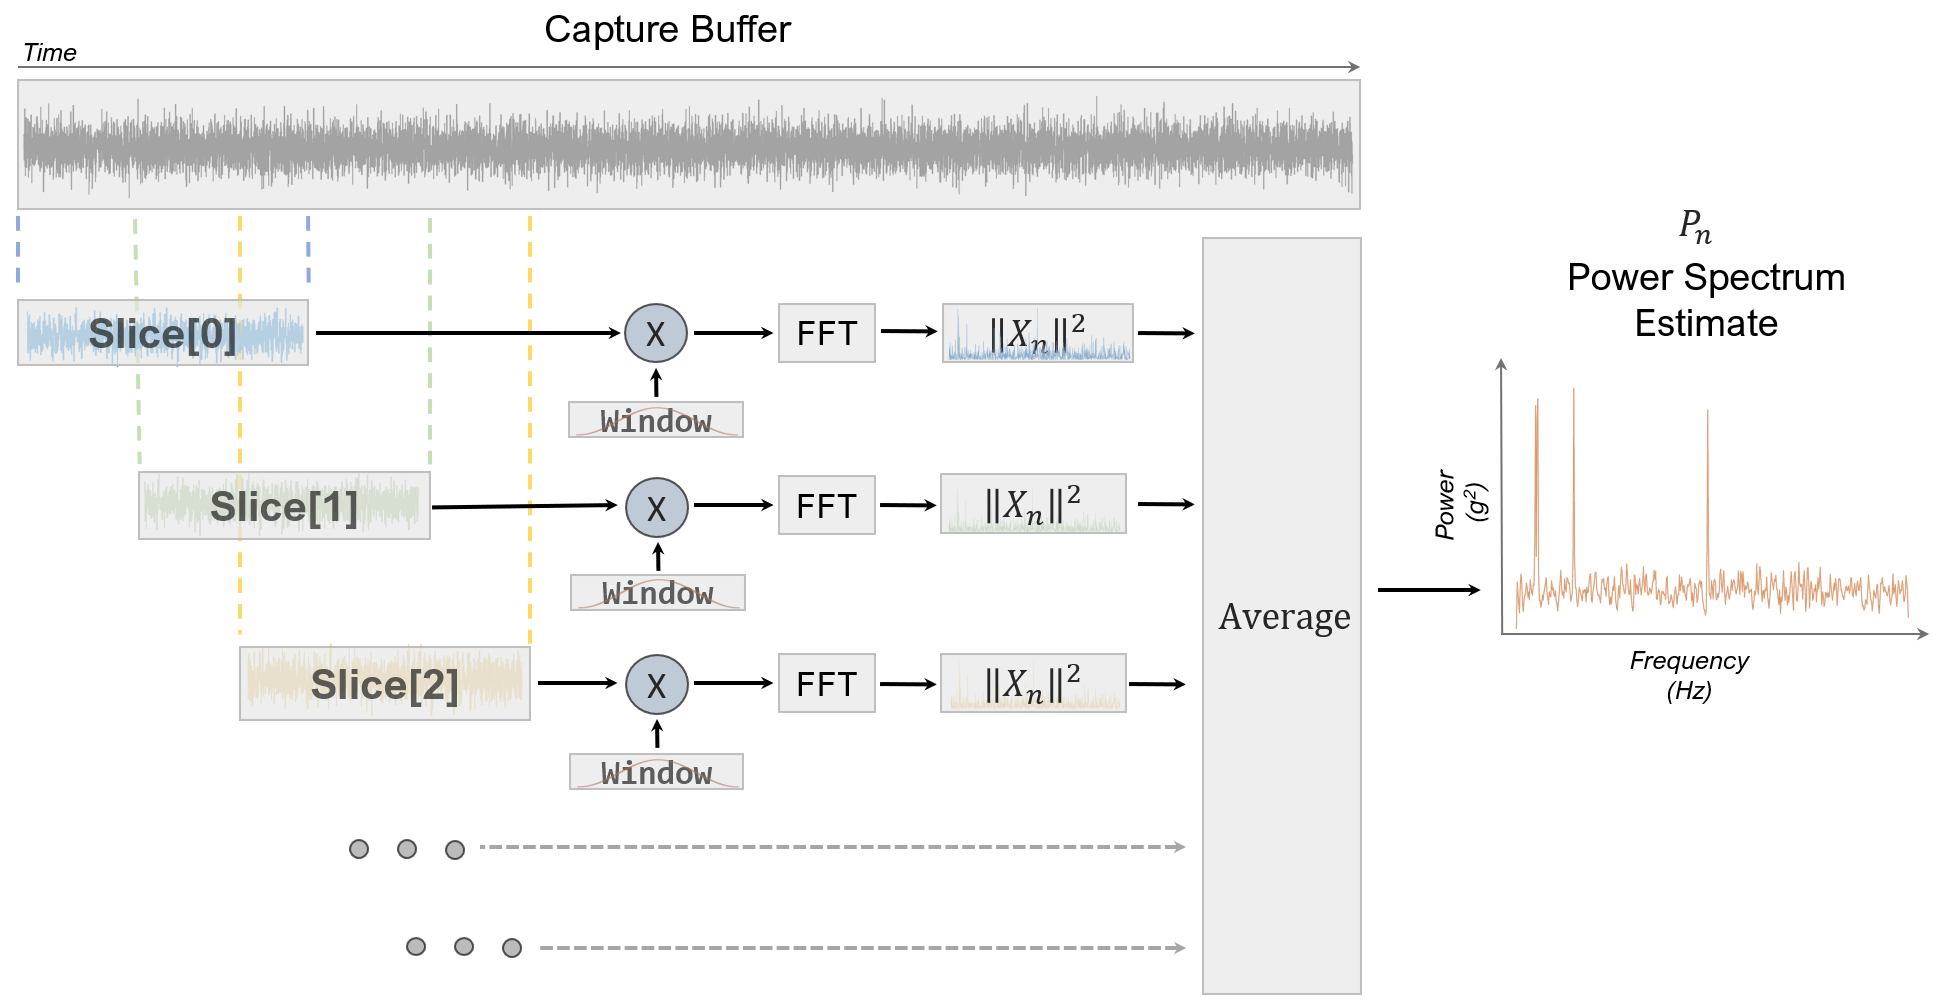
Starting with a large capture buffer, you take overlapping slices of data. Each slice is multiplied by a “window” function. This product fed to an FFT. The magnitude squared value of the FFT result is computed and then Averaged. The result is a set of data that represents the power in a range frequency bin. It is common to normalize the power in each bin to a 1Hz bin width.
Writing embedded code to estimate a power spectrum on time-series requires an Fast Fourier Transform (FFT). The open-source ARM CMSIS DSP libraries are baked into zephyr. You can enable specific features in the application proj.conf file.
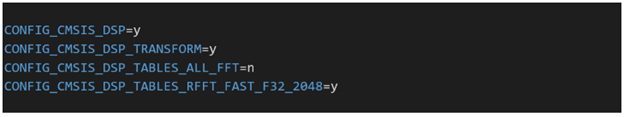
CMSIS DSP is structured such that you can enable only the bits you want. In the case of the FFT implementation, you can enable only the lengths that you plan on using, saving flash memory for the twiddle lookup tables, etc. My implementation of a power spectrum estimation results used 2048 points FFTs.
Once enabled in the proj.conf file, using CMSIS DSP is straightforward. You need to allocate an instance of the FFT struct:

Initialize it:

and then use it!

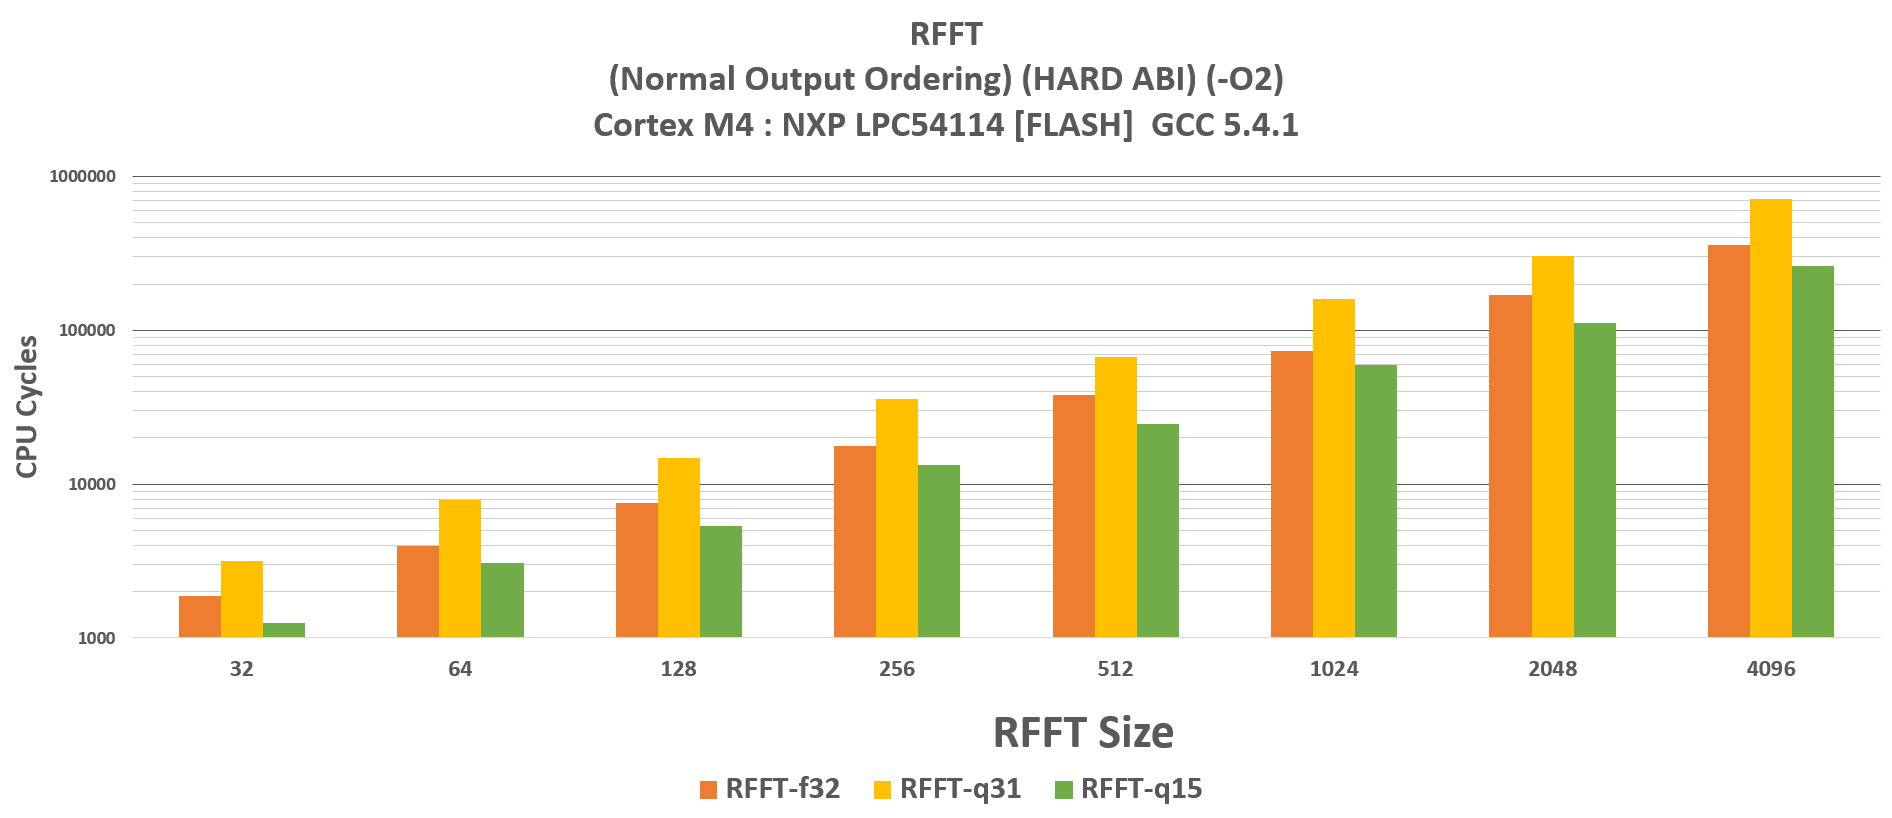
This is an example of the floating-point version of the CMSIS DSP FFT. CMSIS DSP also supports fixed point versions for 16-bit and 32-bit data types. The Cortex M4F core in the nRF9160 has hardware floating point capabilities. Several years ago, I did a comparison study of the CMSIS DSP FFT performance across the different input sizes and data types. In terms of speed the floating-point implementation is faster than the 32-bit fixed point. The 16-bit version is the quickest as the compiler can make use of some 16-bit SIMD instructions that efficiently compute the FFT butterflies. However, make sure to read the CMSIS DSP documentation if you use the fixed point versions as there are details about the integer scaling through the FFT pipeline that must be taken into consideration.
For the MachineMailbox application, processed data was transmitted to a backend using a secure, stateless protocol over UDP. Sending frequency domain vibration data to a cloud backend can be challenging if one does not set reasonable boundaries on the size of the data. Since this is a low bandwidth cellular CAT-M application, it was important to send enough data to enable machine monitoring algorithms in the cloud backend while keeping an eye on the cellular data costs. It was also beneficial for a single vibration spectrum to fit into one Ethernet V2 MTU of 1500 bytes, so the data set did not have to be split over multiple frames.
The output of the power spectrum estimation can yield a wide dynamic range through the FFT and averaging process. For the purposes of processing frequency domain data, we can use a priori knowledge of measurement physics to compress the data a bit.
The unit of the acceleration power spectrum is g2 over the width of the frequency bin. Given the squared nature of the magnitude, we can transform bins of data into the log domain:
This computation gives us an acceleration value in dB scaling (dBg). We can round and store as a signed 8-bit integer. This process will yield a possible power range of -128dBg to +127dBg with 1dBg steps. This is an incredibly dynamic range while being able to resolve nearly imperceptible acceleration in a frequency domain bin (-128dbg is very small).
From the perspective of machine monitoring / anomaly detection, a 1dB step is a good tradeoff for resolution vs data compression. I personally have never observed any real-world anomaly detection models for rugged/industrial processes that required triggers less than 1dB. It is also my opinion that log scaled power spectrum data is one of the most efficient data sources for neural net based processing. Physics-informed, pre-processed data can greatly simplify both the training and real-time crunching of anomaly detection models.
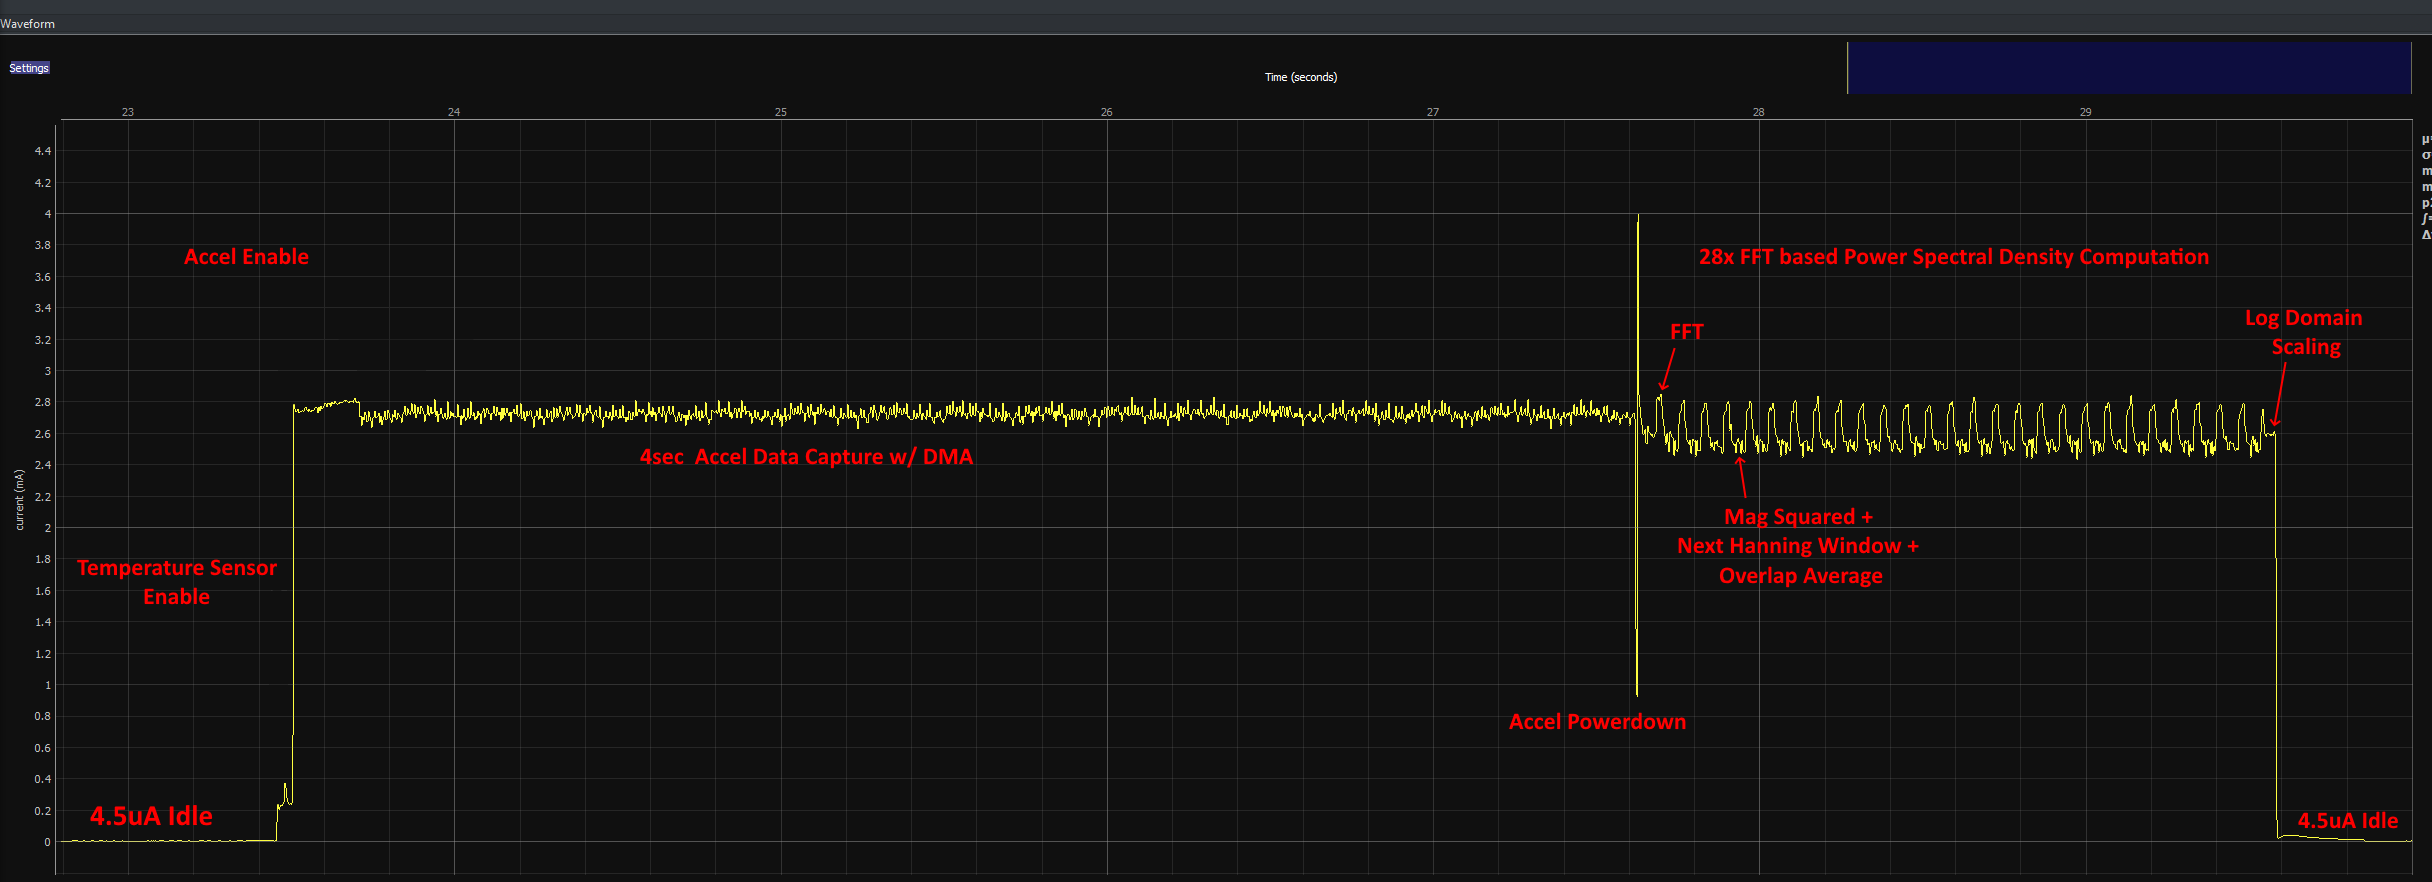
Circuit Current Measurements for Data Acquisition/Processing
Once the data capture and DSP pieces were functional, I measured the total current of the MachineMailbox circuit assembly. This data was fed into a power consumption model to make assessments of battery like. I used a Joulescope DC energy analyzer to monitor current consumption to profile the system.
Once I got the initial pipeline working, I could more easily identify where I should be focusing time to optimize. For example, to improve battery life, I could choose to overlap some of the power spectrum computations with the data capture. Since the power spectrum requires fixed size slices of data, the FFT and averaging could be started as soon as the 1st slice is available. Because we are using highly tuned interrupt-based data capture, it is possible to get a lot of work completed in an efficient manner and get the NRF9160 back to sleep quickly.
In the MachineMailbox use case, I found that most of the optimization needed to be directly at queueing up vibration spectrums to minimize the number of transmits to the cloud backend. Even when taking CAT-M PSM states into consideration, there was a delicate balance of how often to measure data and how often to transmit to achieve multi-year battery life.
Conclusion
The combination of direct IRQ, multi-peripheral interface combined with embedded DSP and high-level Zephyr network APIs enabled me to get pretty vibration / temperature pictures such as this:
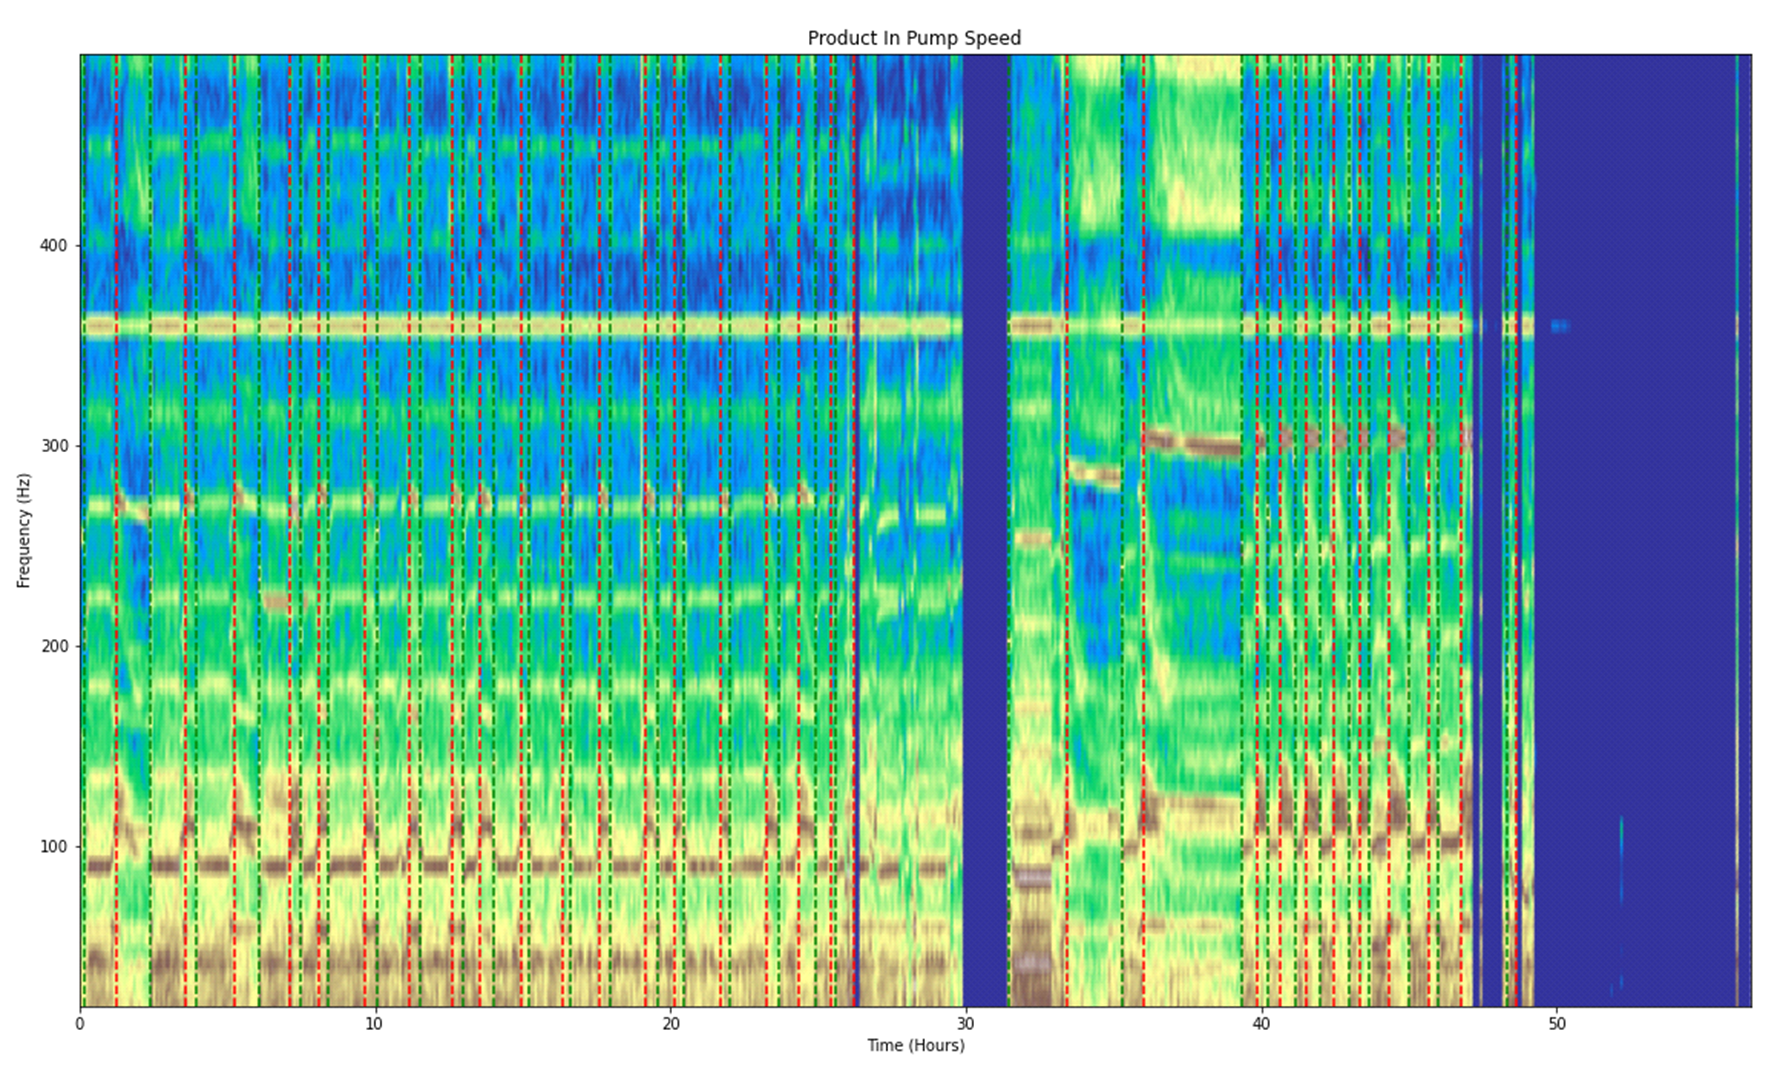
Zooming in, one call pull out interesting characteristics of the machine and other equipment downstream. In this case, the MachineMailbox sensor was mounted on an inlet pipe of a large plate heat exchanger. We could pull out a variable speed pump characteristic of pump that was hooked up downstream from the heat exchanger.
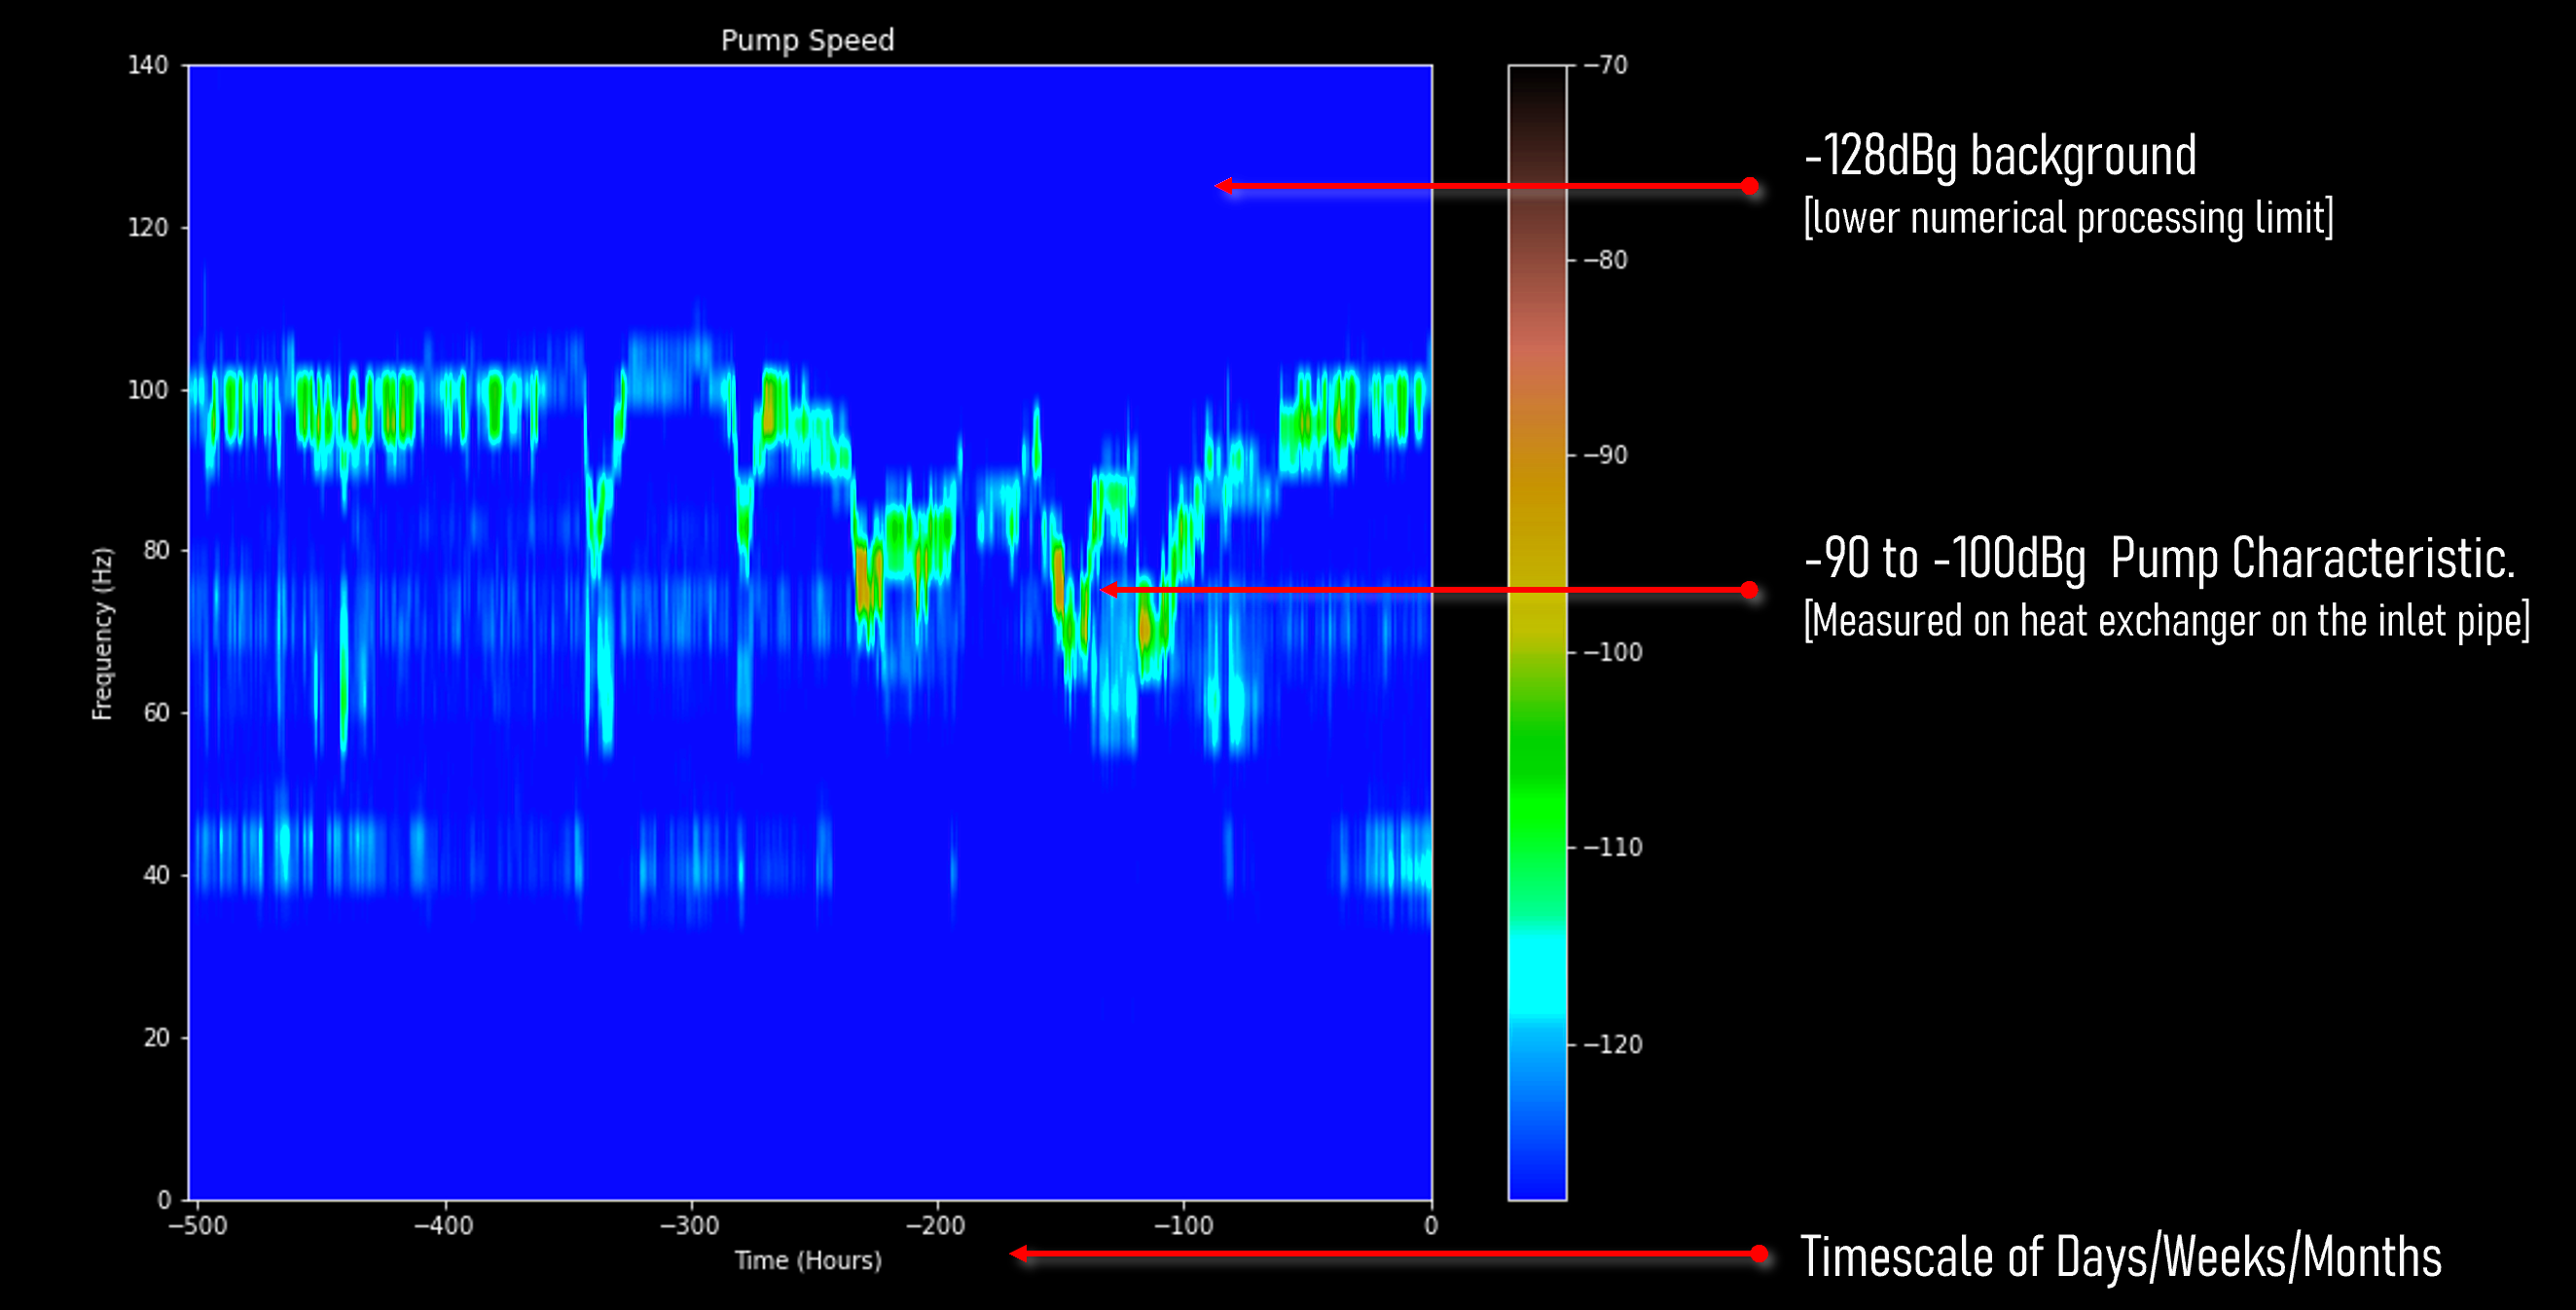
The vibration power spectrums can accumulate in the backend over time to be stacked to form 2D images. It is easy to see where AI / machine learning can come in to extract trends and patterns.
Using Zephyr enabled me to get the best of all worlds. I could operate as close to the “metal” as I wanted while getting all the benefits of the build system, high level RTOS APIs, network drivers and common system functions such logging, shells and flash settings. The result for the MachineMailbox was a vibration sensing system that can be easily installed and deliver edge processed data securely to a cloud backend via the cellular networks. All of this achieving getting multi-year battery life in a real-world acoustic machine monitoring application.